interactive
February 1, 2009
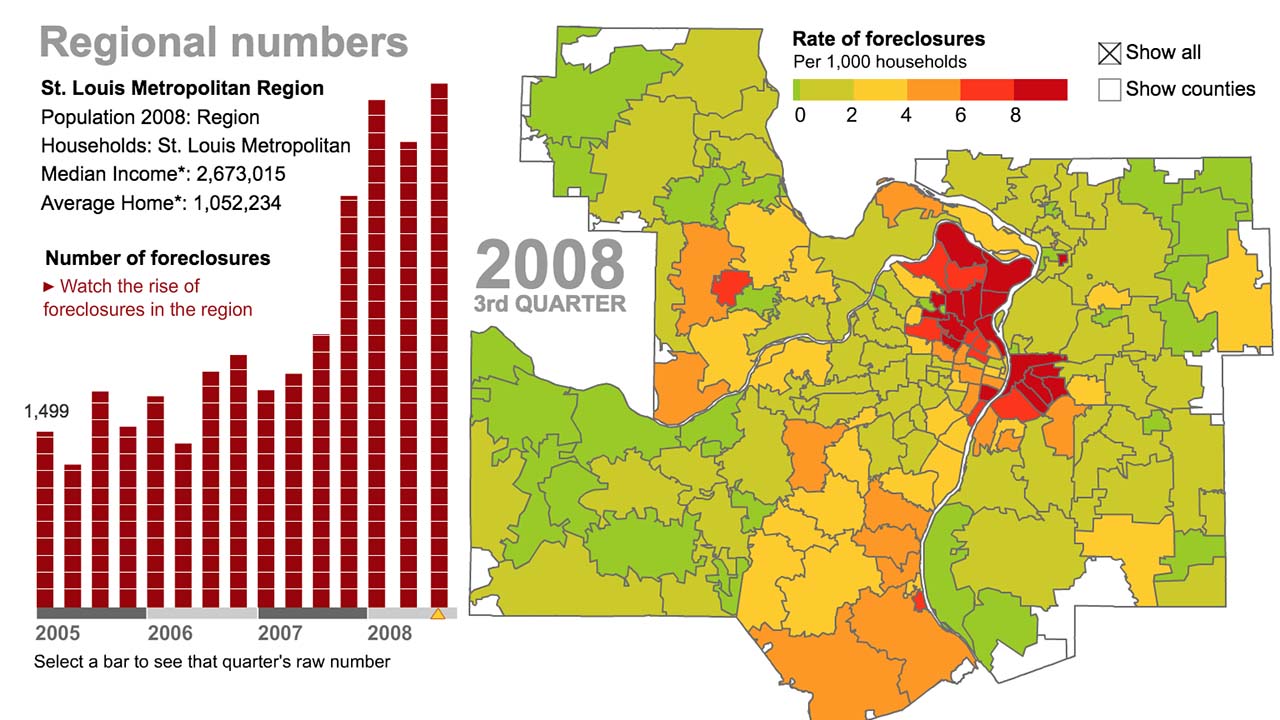
Explore the St. Louis foreclosure crisis
Brian Williamson | St. Louis Post-Dispatch
The Post-Dispatch analyzed a database of distressed properties from 2005 through September 2008 to assess the extent of foreclosures in the St. Louis area.
This Flash-based interactive graphic shows which ZIP codes in the St. Louis region were hardest hit by foreclosures from 2005 to 2008. It features an animated map, audio narration and the ability to search the results by ZIP code.
RESPONSIBILITIES
I worked closely with Jaimi Dowdell and Kevin Crowe, who provided the primary data analaysis. I created the map, designed the graphic, and wrote the code to create the visualization. I recorded the audio analysis by Tim Logan and synchronized to different views of the data to help explain the growth of foreclosures in the region.